



With global data volumes growing by 23% annually, the average UK enterprise is now drowning in information whilst starving for clarity. You’ve likely felt the drain of manual data cleaning or the frustration of inconsistent reports that lead to more questions than answers. When your team spends more time wrestling with legacy Excel sheets than turning raw data into insights, your information has become a liability rather than a strategic asset.
We understand the pressure to deliver clear results from complex, fragmented datasets. This guide provides a professional framework for transforming raw information into actionable business intelligence that drives measurable growth. We’ll explore how to replace labour-intensive processes with automated reporting pipelines and a unified view of your organisational performance. You’ll learn to foster an evidence-based culture that secures a clear ROI from your data investments and prepares your business for the future.
Key Takeaways
- Learn to distinguish between unrefined digital exhaust and the high-value discoveries that trigger specific, strategic business actions.
- Master the professional framework for turning raw data into insights by building a robust engineering bridge between fragmented CRM and ERP sources.
- Shift from simply describing past performance to diagnosing specific business behaviours through advanced statistical correlations and pattern recognition.
- Identify the most effective visual narratives to ensure stakeholders can immediately interpret complex performance metrics and growth trends.
- Evaluate how a strategic partnership accelerates your time-to-value whilst eliminating the security risks and technical debt common in DIY data projects.
Understanding the Value Gap: What is Raw Data vs Actionable Insights?
Most UK enterprises generate vast quantities of “digital exhaust” every second. This raw data represents the unrefined byproduct of your daily operations, from point-of-sale transactions to server logs and customer interactions. Whilst these datasets are technically valuable, they remain inert until processed. The process of turning raw data into insights requires moving beyond simple collection to find the underlying narrative that dictates your business performance.
An insight isn’t just a number on a screen. It’s a discovery that prompts a specific, strategic action. If a report shows sales are down, that’s simply information. If the data reveals that sales are down specifically amongst a particular customer segment aged 25-34 because of a competitor’s recent pricing shift, that’s an insight you can act upon. Insights bridge the gap between knowing something happened and knowing how to fix it.
Many UK organisations struggle with this transition because of the “Data Silo” problem. Information often sits trapped in legacy Excel sheets or isolated department databases, preventing a holistic view of the company. Business Intelligence (BI) serves as the essential translator here. It bridges the gap between technical data analysis and corporate strategy, ensuring that every byte of data serves a commercial purpose.
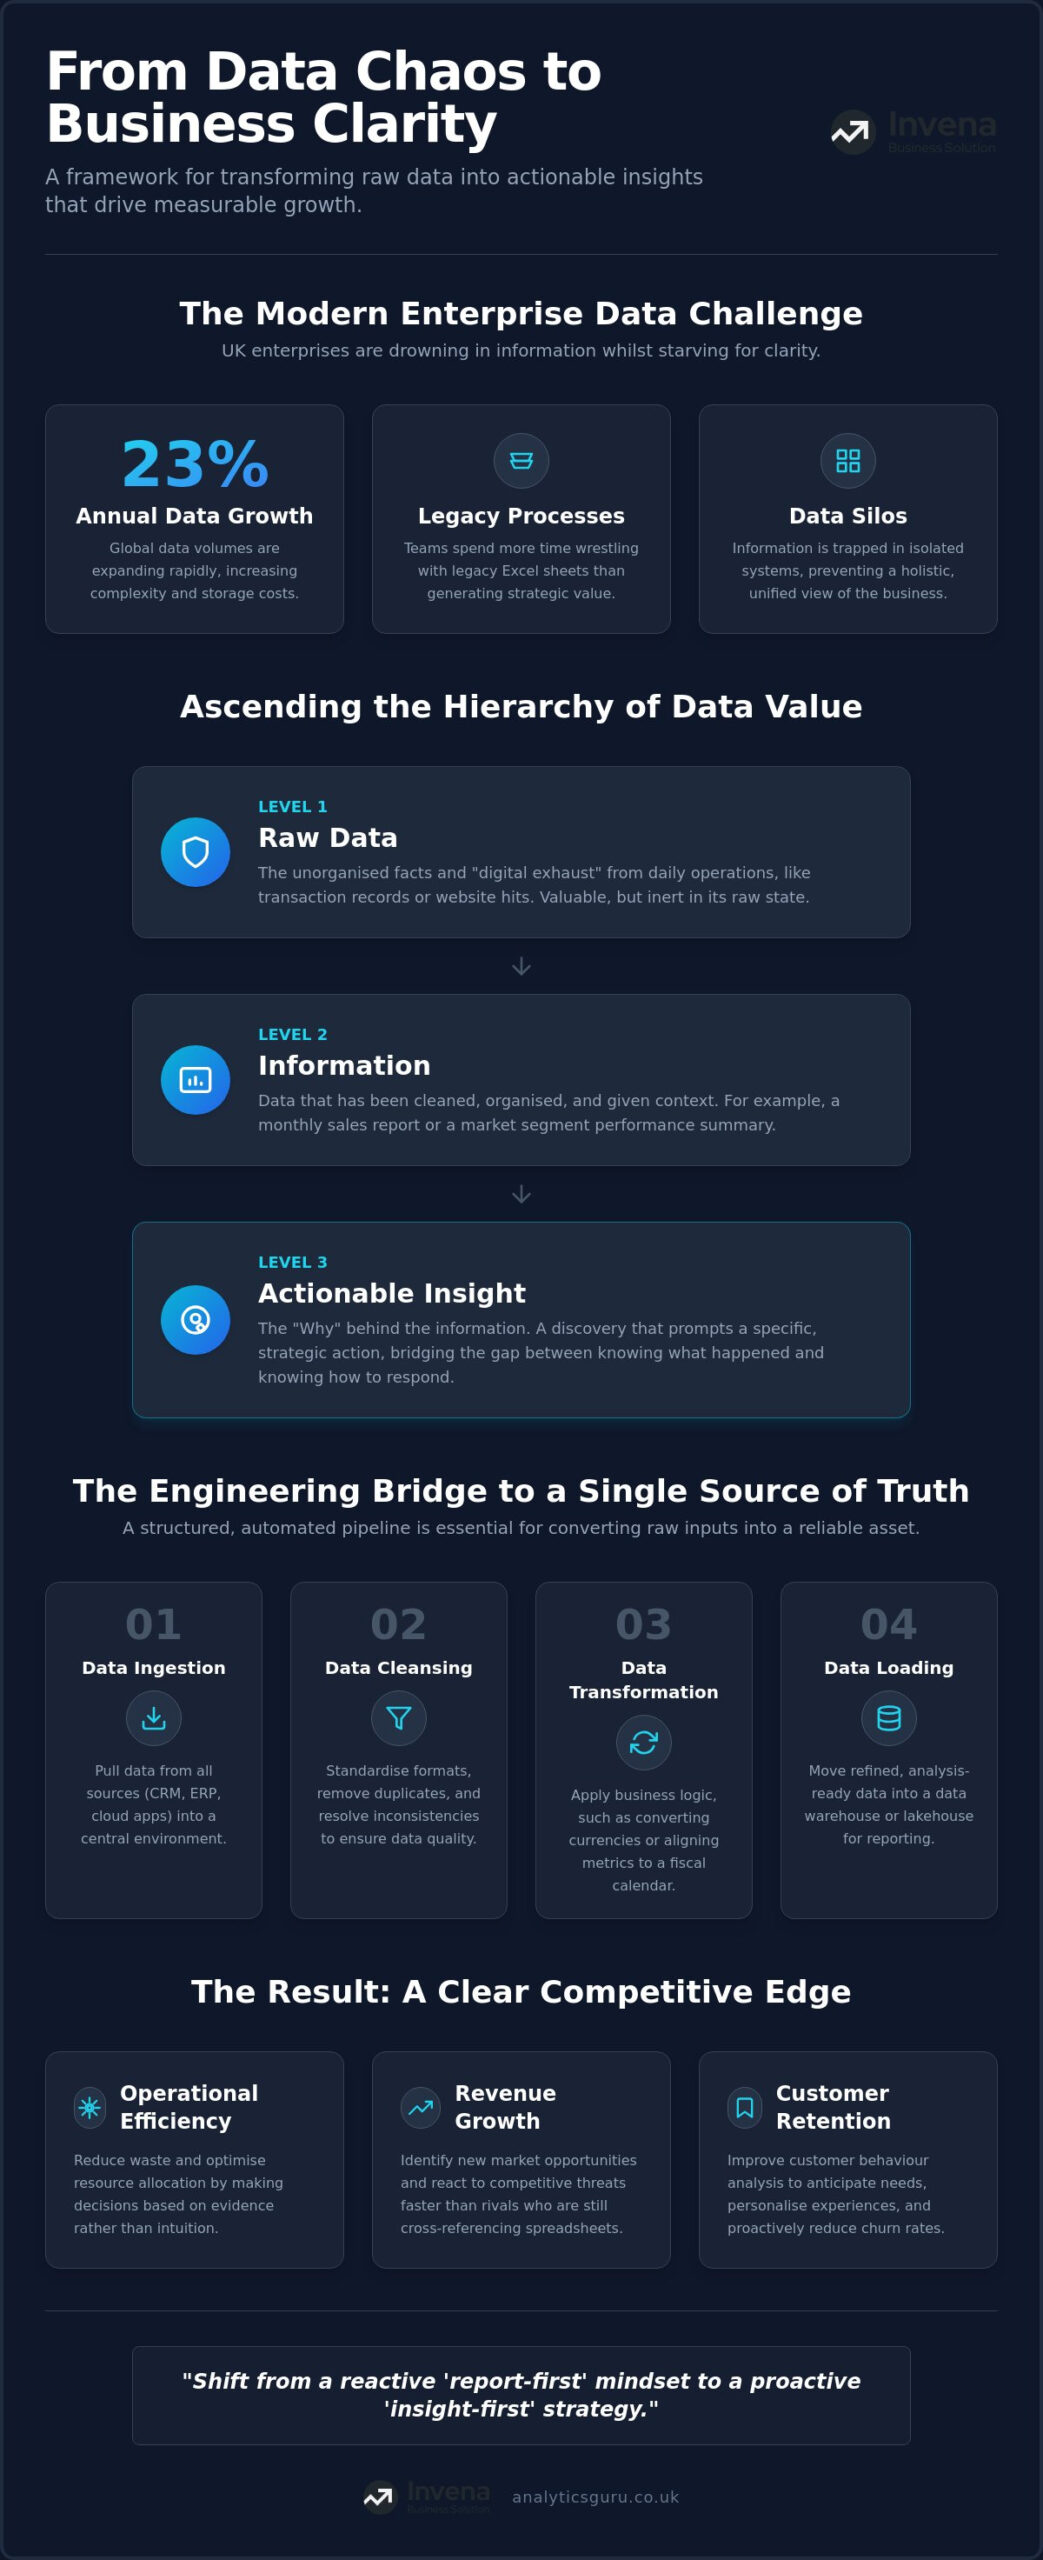
The Hierarchy of Data Transformation
To master this process, you must understand the three distinct stages of data maturity:
- Data: The raw, unorganised facts, such as a list of individual transaction records or website hits.
- Information: Data that has been cleaned and organised with context, like a monthly sales report or a market segment performance summary.
- Insights: The “Why” behind the information. This level of maturity allows you to understand why sales dropped amongst a specific demographic or why a supply chain delay occurred.
Why Actionable Insights Matter for UK Enterprises
Modern enterprises can’t afford to guess. Turning raw data into insights provides a competitive edge in several critical areas:
- Operational Efficiency: Reducing waste by allocating resources based on evidence rather than intuition.
- Revenue Growth: Identifying new market opportunities whilst competitors are still manually cross-referencing spreadsheets.
- Customer Retention: Improving customer behaviour analysis to anticipate needs and reduce churn rates.
By shifting from a reactive “report-first” mindset to a proactive “insight-first” strategy, you turn your data from a storage cost into a growth engine.
The Engineering Bridge: Organising and Cleaning Raw Datasets
Raw data is rarely ready for immediate consumption. Most UK enterprises find that their information is fragmented across disparate systems, requiring a robust technical bridge to make it usable. Turning raw data into insights is not a matter of simply opening a dashboard; it’s the result of a structured engineering process that converts unrefined inputs into a reliable asset. Developing the right skills for turning data into insight begins with moving away from manual spreadsheet manipulation and adopting automated workflows.
The journey from ingestion to insight follows four critical stages:
- Step 1: Data Ingestion. This involves pulling data from your CRM, ERP, and cloud sources into a centralised environment. Speed and reliability are paramount here to ensure no information is lost in transit.
- Step 2: Data Cleansing. We standardise formats and remove duplicates amongst your datasets. This stage eliminates the “garbage in, garbage out” risk that often plagues manual reporting.
- Step 3: Data Transformation. Here, we apply business logic to the raw figures. This might include converting currencies to GBP or aligning various department metrics to a single fiscal calendar.
- Step 4: Data Loading. The refined data is moved into a centralised “Single Source of Truth,” such as a data warehouse or lakehouse, where it’s ready for analysis.
Leveraging Microsoft Fabric for Unified Data Engineering
Microsoft Fabric has revolutionised this process for UK businesses through its “OneLake” architecture. It eliminates the need to maintain multiple copies of the same dataset, which significantly reduces storage costs and improves performance. By providing a unified platform for both engineering and analytics, it allows your team to focus on growth whilst we manage the underlying infrastructure. Our Data Engineering & Fabric Services help organisations automate these pipelines, ensuring your technical foundation is as reliable as your strategy.
Ensuring Data Integrity and Governance
Consistency is the bedrock of trust. We implement “Golden Records” to ensure that every department, from finance to marketing, is looking at the same verified numbers. Within the UK regulatory landscape, particularly following the Data (Use and Access) Act 2025, maintaining strict data governance is no longer optional. Automated ETL pipelines provide the audit trails and security necessary for compliance, replacing the inherent risks of manual Excel entries with a secure, scalable framework.
Advanced Analytics: Identifying Patterns and Business Behaviours
Building a robust data pipeline is only half the battle. The true competitive advantage lies in your ability to interpret that information to influence future outcomes. Turning raw data into insights requires a shift in focus from descriptive analytics, which simply catalogues past events, to diagnostic and predictive models. By applying statistical correlations amongst disparate data points, you can move beyond surface-level reporting to uncover the underlying drivers of your business performance.
Effective analysis starts with the right business questions. Instead of asking “How many units did we sell?”, a strategic leader asks “Why did sales volume fluctuate amongst our Midlands-based accounts last quarter?”. This approach ensures that turning raw data into insights becomes a repeatable process that solves commercial problems. Modern Business Intelligence platforms now integrate AI and Machine Learning to accelerate this process, identifying patterns that would be invisible to the human eye whilst removing the manual effort of traditional data mining.
Diagnostic Analytics: Finding the ‘Why’
Diagnostic analytics allows you to drill down into the specifics of your operational data to identify root causes. Whether you’re investigating a sudden spike in customer churn or an unexpected supply chain delay, these tools provide the clarity needed for decisive action. Using Power BI, you can cross-reference multiple data sources in real-time, allowing you to:
- Identify product-level anomalies that might indicate a quality control issue.
- Correlate marketing spend with specific customer behaviours to determine true acquisition costs.
- Analyse regional performance variations to reallocate resources where they’ll have the highest impact.
Predictive Analytics: Anticipating Future Trends
The most sophisticated UK enterprises use their data to look forward rather than backward. Predictive analytics is the process of using historical data to forecast future outcomes with statistical probability. By leveraging AI-driven insights, you can anticipate market shifts before they impact your bottom line.
Demand forecasting is a prime example of this capability in action. By analysing historical seasonal patterns and current market indicators, businesses can optimise inventory levels to reduce holding costs whilst ensuring they meet customer needs. Similarly, machine learning models can predict which leads are most likely to convert, allowing your sales team to prioritise high-value opportunities with precision. This proactive stance turns your data into a visionary tool for long-term stability and growth.
Data Visualisation: Crafting a Compelling Narrative for Stakeholders
Visualisation represents the final mile of the data journey. It’s the interface where technical complexity meets executive decision-making. By turning raw data into insights through high-impact visuals, you ensure that complex datasets are immediately accessible to every stakeholder in the organisation. A well-designed dashboard doesn’t just show numbers; it tells a story that justifies strategic investment and identifies hidden risks before they impact the bottom line.
Choosing the right favour of chart is critical for clarity. Bar charts remain the gold standard for direct comparisons, whilst heatmaps are superior for identifying geographical or temporal density. Treemaps allow users to visualise hierarchical parts-to-whole relationships at a glance. We also leverage the psychology of colour and layout to guide the viewer’s eye. Strategic use of red, amber, and green indicators immediately signals where attention is required, whilst a clean, logical layout ensures the most critical KPIs are prioritised. Static reports are no longer sufficient. Modern dashboards must be interactive, allowing users to drill down from high-level summaries into granular operational detail without leaving the interface.
Best Practices for Power BI Dashboard Development
Effective dashboard design starts with the user. A CEO requires high-level strategic trends to guide long-term growth, whilst an operational manager needs the granular detail required to handle daily tasks. We adhere to the “5-second rule,” where a user should grasp the primary performance indicator within five seconds of viewing the screen. This minimises cognitive load and ensures the most important information isn’t lost in the noise. Integrating real-time alerts further enhances this efficiency, prompting immediate business action when a metric falls outside of expected parameters. To see how these principles apply to your organisation, explore our Power BI Implementation services.
Storytelling with Data: Moving from Charts to Action
Storytelling moves the conversation from “what happened” to “what do we do next”. Framing your data findings within the context of specific business objectives ensures that every visualisation serves a commercial purpose. We often utilise “Natural Language” summaries to explain complex visualisations in plain English, removing the ambiguity that can lead to misinterpretation. This clarity is essential for creating a culture of data-driven decision-making amongst all staff levels. When turning raw data into insights is handled with this level of precision, every team member understands how their performance contributes to the wider strategy, fostering a more transparent and accountable work environment.
Scaling Insight Generation: Why a Strategic Partnership is Essential
Whilst the technical steps for turning raw data into insights are well-defined, executing this transformation at an enterprise scale often introduces unforeseen friction. Many UK organisations fall into the “DIY trap,” attempting to build complex analytics environments with internal resources that may lack specific engineering expertise. This approach frequently leads to fragmented data logic, security vulnerabilities, and significant technical debt. A strategic partner acts as a steady hand, navigating these intricate technical challenges whilst your leadership team focuses on core commercial growth.
Speed to value remains the primary differentiator in the modern UK market. An experienced BI reporting consultant bypasses the common pitfalls of trial and error, delivering a production-ready environment in a fraction of the time required for internal development. This acceleration ensures your business can respond to market shifts with precision, turning your information into a defensive moat against competitors who are still wrestling with manual spreadsheets. By professionalising your data stack, you move from reactive reporting to a proactive stance where data dictates every strategic move.
The Analytics Guru Approach to End-to-End Delivery
We bring over two decades of experience to every engagement, specialising in turning raw data into insights that have a direct impact on your bottom line. Having completed over 100 projects for diverse UK enterprises, we understand the nuances of local regulatory requirements and industry-specific performance metrics. Our 99%+ customer retention rate is a testament to the technical reliability and strategic clarity we provide. We deliver custom Microsoft Fabric and Power BI implementations that are built to scale, ensuring your architecture remains robust as your data volumes grow.
Empowering Your Team through Training
A sophisticated dashboard only delivers value if your staff can interpret the findings and take decisive action. We don’t just hand over a technical solution; we provide comprehensive Training & Support Services to ensure long-term organisational adoption. This empowerment allows your team to navigate complex visualisations independently, fostering a culture where evidence-based decision-making becomes the standard at all staff levels. Our managed support keeps your automated pipelines running smoothly whilst you focus on expansion, providing the stability needed for consistent performance. To begin your transformation, optimise your data strategy with Analytics Guru and turn your fragmented datasets into a visionary business asset.
Building Your Data-Driven Future
Transitioning from fragmented datasets to strategic clarity requires more than just new software; it demands a structured approach to data engineering and a commitment to diagnostic analysis. By bridging the gap between unrefined information and executive decision-making, you transform your daily operations into a high-performance growth engine. Successfully turning raw data into insights ensures your organisation remains agile and informed in an increasingly competitive UK landscape.
Analytics Guru provides the steady hand needed to navigate this technical evolution. With over 20 years of BI consultancy experience and a portfolio of 100+ successfully completed data projects, we specialise in high-impact Microsoft Fabric and Power BI implementations. We handle the technical complexity so your team can focus on what matters most: driving your business forward. Book a strategic data consultation with Analytics Guru today to secure your competitive advantage and start leading with evidence.
Frequently Asked Questions
What is the process of turning raw data into insights?
The process involves a structured pipeline of data ingestion, cleaning, transformation, and visualisation. It starts by collecting unrefined facts from various sources and moving them through an engineering bridge to ensure accuracy. Once the data is refined, statistical modelling and diagnostic analytics are applied to uncover the underlying narratives that drive business performance.
How do you turn data into actionable insights for a business?
You turn data into actionable insights by starting with a specific business question rather than just looking at numbers. Align your analysis with commercial objectives, such as reducing operational waste or identifying new revenue streams. By using diagnostic tools to find the “why” behind performance trends, you create discoveries that prompt immediate strategic changes.
What are the 5 steps of data analysis in a professional setting?
A professional framework typically follows five stages: defining the business objective, collecting relevant data, cleaning the datasets, performing the analysis, and interpreting the results. This methodical approach ensures that every byte of information processed contributes directly to a strategic goal. It prevents teams from getting lost in “vanity metrics” that don’t impact the bottom line.
Why is data cleaning the most important part of the insight process?
Data cleaning is vital because it prevents the “garbage in, garbage out” scenario that leads to flawed decision-making. By standardising formats and removing duplicates amongst your datasets, you ensure the final visualisations are based on a “Single Source of Truth”. This builds the internal trust necessary for stakeholders to act on the findings without questioning the underlying figures.
What tools are best for turning raw data into insights for UK enterprises?
Microsoft Fabric and Power BI are the premier choices for UK enterprises due to their seamless integration with existing Microsoft 365 environments. These platforms support automated ETL pipelines and real-time reporting at scale. Tableau also remains a powerful option for organisations that require highly specialised, complex visualisations for deep-dive exploratory analysis.
How long does it take to see a return on investment from a BI project?
Most enterprises begin to see a measurable ROI within three to six months of implementation. Initial gains often come from the massive reduction in manual labour required for reporting. Longer-term value is realised as evidence-based decisions improve customer retention and optimise resource allocation, which directly impacts profitability and market position.
What is the difference between data analysis and data insights?
Data analysis is the technical process of inspecting, cleansing, and modelling data to find patterns. Insights are the strategic conclusions and “aha!” moments that result from that analysis. Whilst analysis might show that website traffic has increased, an insight reveals that the increase is driven by a specific demographic looking for a product your competitors don’t stock.
Can Microsoft Fabric help in turning raw data into insights faster?
Microsoft Fabric accelerates the process by utilising a unified “OneLake” architecture that eliminates the need for data duplication. It allows data engineers and business analysts to work within the same environment simultaneously, reducing the time spent on moving data between systems. This streamlined workflow significantly shortens the time-to-value for complex data transformation projects.