



Migration is not a file transfer; it is an architectural shift from manual data manipulation to automated data governance. You’ve likely experienced the friction of version control chaos or the sluggish performance of bloated workbooks that struggle with large datasets. It’s a common frustration amongst UK enterprises where manual data entry leads to avoidable human error, making it nearly impossible to maintain a single version of the truth for your business KPIs.
If you’re ready to migrate Excel to Power BI, you’re moving toward a more resilient and scalable future. We agree that your team’s time is better spent on high-level analysis than on fixing broken formulas. This article provides a structured, scalable template to transition your organisation from static spreadsheets to dynamic, automated dashboards. We will examine the essential steps for cleaning data definitions, implementing robust security, and building an interactive reporting environment that updates in real-time to drive informed decision-making.
Key Takeaways
- Identify the “Excel Ceiling” where manual workbooks hinder growth and learn how to rationalise your reporting suite for maximum impact.
- Implement a proven 5-step framework to migrate Excel to Power BI, ensuring a seamless transition from static files to automated dashboards.
- Master the technical foundations of Power Query and DAX to replace fragile formulas with scalable, high-performance data models.
- Secure your enterprise data using Row-Level Security whilst maintaining full compliance with the latest UK GDPR and data protection regulations.
- Position your initial migration as a strategic stepping stone toward a unified data architecture within the Microsoft Fabric ecosystem.
Overcoming the Excel Ceiling: Why Organisations are Migrating to Power BI
For many UK enterprises, the spreadsheet was the original engine of growth. But there comes a specific point, often termed the “Excel Ceiling,” where the tool that once enabled agility becomes the anchor dragging down your operations. This ceiling is reached when workbooks become too complex to audit, too large to open quickly, and too manual to trust. When your analysts spend 80% of their week cleaning data and only 20% interpreting it, your reporting architecture is fundamentally broken. Deciding to migrate Excel to Power BI represents a strategic shift from static, reactive reporting to proactive, exploratory analytics.
The cost of inaction is high. Whilst your team manually reconciles VLOOKUPs and corrects broken links, your competitors are leveraging real-time insights to capture market share. This transition is not merely about replacing one software with another; it is about moving from “data preparation” to “data storytelling.” Instead of presenting a flat table of figures, you provide an interactive environment where stakeholders can drill down into the “why” behind the numbers. This clarity removes the obstacles to growth and empowers leadership to make decisions based on facts rather than intuition.
The Limits of Spreadsheet-Based Decision Making
Spreadsheets are inherently fragile. A single incorrect cell reference or a hidden formula error can ripple through a financial model, leading to significant miscalculations that often go undetected until it is too late. Security risks also multiply when sensitive .xlsx files are emailed across the organisation. This decentralised approach creates multiple “dark” copies of data, making it impossible to establish a unified data lineage. Without a central source of truth, different departments often present conflicting figures, leading to boardroom friction and stalled projects.
The Power BI Advantage for Modern Enterprises
Modern business intelligence requires speed, scale, and security. Microsoft Power BI offers a centralised platform where data refreshes automatically via secure gateways. This removes the manual burden of data entry and ensures that your reports are always current. One of the most significant benefits is the implementation of Row-Level Security (RLS). This allows you to restrict data access based on user roles, ensuring that a regional manager only sees their specific department’s performance whilst using the same master report as the CEO.
Furthermore, choosing to migrate Excel to Power BI places your organisation within the wider Microsoft 365 and Fabric ecosystem. This integration allows for seamless data movement and prepares your business for advanced AI workloads. By centralising your logic in a robust data model, you create a scalable foundation that supports everything from simple monthly reporting to complex predictive analytics, ensuring your data remains an asset rather than a liability.
The 5-Step Migration Template: From Spreadsheet to Live Dashboard
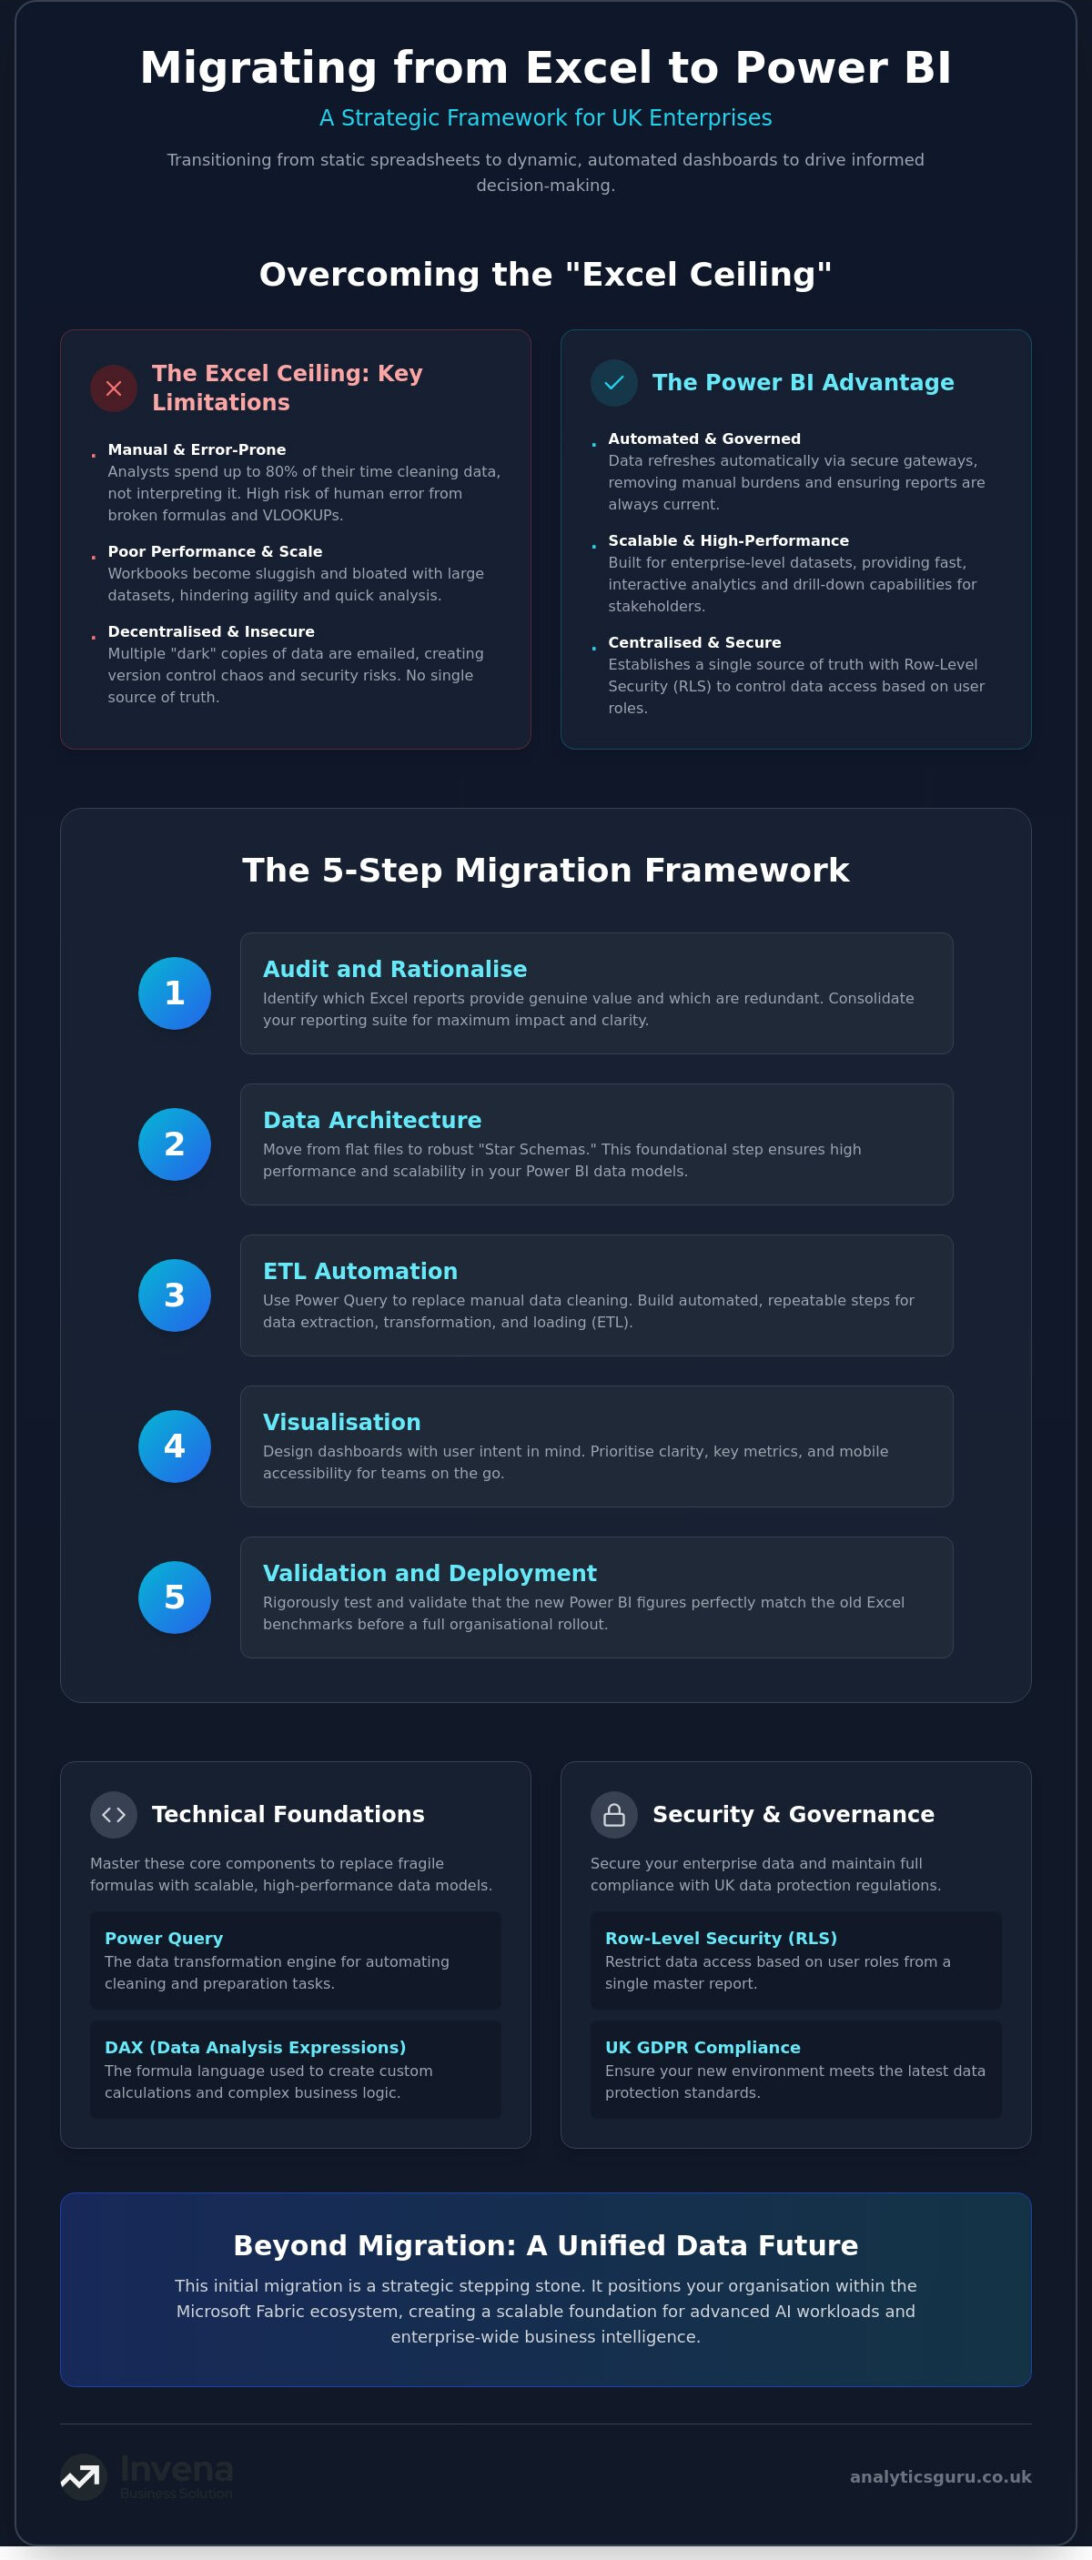
Successful digital transformation requires more than just clicking a “Get Data” button. To effectively migrate Excel to Power BI, you need a repeatable strategy that addresses legacy technical debt and architectural flaws. The Analytics Guru Migration Framework provides this structure, moving your team away from manual “copy-pasting” toward a governed, scalable architecture. This five-step process ensures that your migration isn’t just a file transfer, but a total optimisation of your reporting lifecycle.
- Step 1: Audit and Rationalise. Identify which Excel reports actually provide value and which are redundant.
- Step 2: Data Architecture. Favour “Star Schemas” over flat tables to ensure high performance.
- Step 3: ETL Automation. Use Power Query to replace manual data preparation with automated, repeatable steps.
- Step 4: Visualisation. Design dashboards for user intent, prioritising mobile accessibility for field-based teams.
- Step 5: Validation and Deployment. Rigorously test that the “new” Power BI numbers match the “old” Excel benchmarks before full rollout.
Adopting best practices for Power BI governance and security ensures your new environment remains compliant with UK GDPR whilst providing the agility your departments need. If your current spreadsheet environment is too complex to unpick alone, our Power BI implementation services can help streamline the transition.
Phase 1: Auditing Your Legacy Excel Environment
Don’t just move the mess. Start by categorising every existing report by its business impact and technical complexity. Many organisations find that up to 40% of their spreadsheets are either duplicates or no longer used. Identifying these redundant sources early streamlines the project. You must also document the “hidden” logic embedded in complex Excel macros. Translating these business rules into a centralised model is the only way to ensure consistency across the organisation.
Phase 2: Building a Robust Data Model
One of the biggest mistakes is importing a flat Excel sheet without restructuring it. For Power BI to perform at scale, you must separate your data into Fact tables (the numbers) and Dimension tables (the context, such as dates, products, or geography). This “Star Schema” approach creates a single version of the truth that can serve multiple dashboards simultaneously. It prevents the data silos common in decentralised spreadsheets and ensures that when one figure updates, it reflects accurately across every related report in the business.
Technical Foundations: Master Power Query and DAX During Transition
To successfully migrate Excel to Power BI, your technical team must move beyond simple data imports and master the two core engines that drive the platform. Power Query handles the extraction and cleaning, whilst DAX (Data Analysis Expressions) provides the analytical depth. This shift requires moving business logic out of individual report cells and into a centralised data layer, ensuring consistency across the entire enterprise. Power Query is an M-based ETL tool that automates data cleaning tasks.
Think of Power Query as the engine room of your migration project. It replaces the hours your analysts currently spend on manual “data janitor” work. By establishing a direct connection to your source files, you create a repeatable pipeline where every cleaning step is recorded. This transition allows your team to focus on high-value insights rather than the mechanical drudgery of fixing broken spreadsheet links. DAX serves as the sophisticated successor to Excel formulas, offering a level of scalability and performance that static workbooks simply cannot match.
Replacing VLOOKUPs and Pivots with Relationships and Measures
In the spreadsheet world, VLOOKUPs and XLOOKUPs are the standard for joining data. However, these formulas are memory-heavy and prone to breaking when rows are added or deleted. Power BI replaces these with a formal relationship model, which is significantly more efficient for large datasets. This architectural change allows you to link tables based on common keys without duplicating data across multiple columns.
When you migrate Excel to Power BI, you must also choose between Calculated Columns and Measures. Calculated Columns are computed during data refresh and stored in the model, consuming memory. Measures, however, are calculated on the fly based on the user’s filters. This makes Measures the preferred choice for business KPIs, such as year-to-date growth or rolling averages, as they ensure your dashboards remain fast and responsive even as your data volume grows.
Automating Data Transformation with Power Query
Power Query provides a transparent, repeatable audit trail through its “Applied Steps” feature. Every time you remove a column, change a data type, or filter a row, the tool records the action. This eliminates the “black box” problem of complex Excel macros that only one person in the office understands. If the underlying data source changes, you simply refresh the report, and Power Query reapplies every transformation automatically.
This automation is particularly powerful when handling “messy” spreadsheet data. Power Query can automatically unpivot columns, handle merged cells, and standardise inconsistent headers across multiple files. By merging and appending disparate Excel workbooks into a unified dataset, you create a robust foundation for your reporting. This process removes the risk of human error and ensures that your final visualisations are built on clean, validated data.
Ensuring Security, Governance, and GDPR Compliance
“Is our data safer in the cloud than in a spreadsheet?” This is the most common objection we encounter when UK firms decide to migrate Excel to Power BI. The reality is that spreadsheets are one of the greatest security liabilities in a modern office. They are often unencrypted, lack audit trails, and are easily attached to external emails. Power BI replaces this fragility with enterprise-grade security that protects your intellectual property whilst enabling collaboration.
A key feature of this secure environment is Row-Level Security (RLS). RLS allows you to control exactly what data a user can see based on their organisational role. This means a single master report can serve your entire company, but a sales lead in one region won’t be able to view the performance data of their counterpart in a different region. This level of granular control is impossible to maintain in a decentralised Excel environment without creating dozens of separate, disconnected files.
To manage this transition effectively, many enterprises adopt a “Centre of Excellence” (CoE) model. This internal body defines the standards for data usage and report design, ensuring that Power BI remains a tool for growth rather than a source of confusion. For UK enterprises, data sovereignty is also a critical factor. Microsoft maintains multiple UK-based data centres, ensuring your information stays within the jurisdiction. Whilst the US CLOUD Act is a consideration for global cloud providers, the robust encryption and compliance features of the Power BI service provide a level of protection that local spreadsheets cannot match. Engaging specialist Power BI consulting services UK enterprises trust can help you navigate these compliance requirements whilst building a scalable, secure data architecture from the outset.
Moving from File Sharing to Workspace Governance
Moving from file sharing to workspace governance eliminates the risks of “Shadow BI.” In the Excel world, users often create their own versions of reports, leading to fragmented and conflicting insights. Power BI uses Workspaces to manage permissions and “Apps” to distribute curated, read-only content to end-users. This keeps the development “sandbox” separate from the production environment. Sensitivity labels further enhance this by tracking confidential information across the entire Microsoft 365 suite, ensuring that sensitive data is handled correctly regardless of where it’s viewed. If you’re looking to de-risk this process, our managed Power BI support can help establish these guardrails from day one.
Meeting UK Regulatory Standards with Power BI
Meeting UK regulatory standards becomes significantly easier when your data is centralised. Under the latest UK GDPR requirements updated in June 2026, organisations must respond to data protection complaints and access requests without undue delay. A unified Power BI model allows you to satisfy “Right to Access” or “Right to Erasure” requests in minutes rather than days. Detailed audit logs provide a transparent record of exactly who viewed which data, giving you the evidence needed for internal or external compliance audits. For more on the strategic landscape of data management, see our Business Intelligence Consulting: A Strategic UK Guide. Setting these foundations correctly ensures that when you migrate Excel to Power BI, you’re building on a platform that’s both powerful and compliant.
Scaling Your Insights: Beyond Simple Migration to Enterprise Intelligence
The first live dashboard is not the finish line; it is the starting point for a data-driven culture. Whilst the immediate goal is to migrate Excel to Power BI to solve version control and performance issues, the long-term value lies in building a foundation for advanced AI and predictive analytics. By centralising your data, you move away from reactive reporting and begin to anticipate market shifts with precision. This transition marks the end of “spreadsheet-literate” silos and the birth of a truly data-literate organisation.
Scaling these insights across a global enterprise requires a shift in how you view your data architecture. It is no longer about individual files but about a unified ecosystem that supports rapid growth. When you migrate Excel to Power BI, you are effectively cleaning your data pipeline to allow for more sophisticated workloads. This prepares your business to leverage machine learning models that can forecast demand, optimise supply chains, and identify customer churn before it impacts your bottom line.
Integrating with Microsoft Fabric and Azure
Microsoft Fabric serves as the unified platform that simplifies the migration of massive legacy datasets. By leveraging OneLake, your organisation creates a single, governed repository that eliminates the need for fragmented data silos. This architecture allows your data engineering team to support sophisticated BI dashboards with high-performance data lakes. Instead of struggling with the limitations of the “Excel Ceiling” discussed earlier, your business can now process millions of rows in seconds, providing the speed and reliability required for enterprise-level intelligence.
Driving Adoption and Continuous Improvement
Success depends on the human element as much as the technical one. Driving adoption requires a continuous feedback loop where users can suggest improvements to dashboard design. Providing tailored training helps bridge the gap for staff accustomed to cell-level calculations, moving them toward a more strategic, set-based analytical mindset. Managed support is essential here; professional oversight prevents reporting stagnation and ensures your environment remains optimised as your data volume grows. Data is your most valuable asset. Treat it that way by partnering with a Power BI implementation expert to ensure a seamless and scalable transition.
Future-Proof Your Enterprise Data Architecture
Transitioning away from the “Excel Ceiling” is more than a technical upgrade; it’s a commitment to organisational clarity and growth. By moving beyond static workbooks, you establish a single version of the truth that scales with your business. You’ve seen how a structured framework, built on robust Power Query automation and secure DAX logic, can transform fragile spreadsheets into resilient assets. Centralising your reporting ensures full compliance with UK regulatory standards whilst empowering your team with real-time, interactive insights.
Choosing to migrate Excel to Power BI is the first step toward a unified intelligence ecosystem. Our UK-based strategic BI consultants bring over 20 years of experience to every project, maintaining a 99% customer retention rate through precision and reliability. We provide the managed support necessary for long-term adoption, ensuring your data remains a driver of success rather than a source of frustration. Streamline your transition with Analytics Guru’s Power BI migration services and unlock the full potential of your business data. It’s time to replace manual effort with automated excellence.
Frequently Asked Questions
Can I still use Excel after migrating to Power BI?
Yes, Excel continues to play a vital role in many organisations for ad-hoc analysis and cell-level financial modelling. A hybrid approach is common, where Excel is used for specific, flexible tasks whilst Power BI serves as the centralised platform for automated enterprise reporting. This ensures that whilst you migrate Excel to Power BI for your core dashboards, you don’t lose the flexibility of your existing spreadsheets for smaller, isolated tasks.
How much data can Power BI handle compared to an Excel workbook?
Power BI far exceeds Excel’s 1,048,576 row limit by using the VertiPaq compression engine to handle millions or even billions of rows. Whilst Excel workbooks often become sluggish or crash when exceeding 100MB, Power BI Desktop files can efficiently manage gigabytes of data. This allows UK enterprises to consolidate years of historical data into a single, high-performance model without compromising performance or stability.
Do I need to learn a new coding language to migrate Excel to Power BI?
You don’t need to be a programmer, but mastering DAX (Data Analysis Expressions) and Power Query’s M language is essential for advanced modelling. If you’re comfortable with complex Excel formulas, you’ll find the logic of DAX familiar, though it requires a shift from cell-based to set-based thinking. This technical foundation is what allows you to replace fragile spreadsheet logic with scalable, automated business rules.
What is the difference between Power BI Desktop and the Power BI Service?
Power BI Desktop is a free application used for data modelling, report authoring, and creating visualisations on your local machine. In contrast, the Power BI Service is a cloud-based platform where you publish those reports to share and collaborate with colleagues. The Service provides the governance, security, and mobile accessibility features that make enterprise-scale analytics possible across your entire organisation.
How do I ensure my migrated dashboards update automatically?
Automatic updates are managed through the Power BI Service using On-premises data gateways. By configuring a scheduled refresh, the platform connects directly to your source Excel files or databases to pull in the latest figures at specific intervals. This removes the manual “copy-paste” burden and ensures that your stakeholders are always viewing a single version of the truth without human intervention.
Is it possible to migrate complex Excel macros into Power BI?
There is no direct “import” for VBA macros; instead, you must rebuild the macro’s logic within Power Query or DAX. Most data cleaning tasks performed by macros are more efficiently handled by Power Query’s repeatable “Applied Steps” feature. This transition creates a more transparent audit trail and eliminates the “black box” security risks associated with legacy spreadsheet code.
How does Power BI handle data security for sensitive UK business information?
Power BI utilises enterprise-grade security features such as Row-Level Security (RLS) to restrict data access based on user roles. For UK organisations, data is typically stored in local Microsoft data centres to satisfy data sovereignty requirements. This centralised model ensures compliance with the latest UK GDPR standards, providing far greater protection than unencrypted spreadsheets shared via internal emails.
What are the licensing costs for a UK organisation moving to Power BI?
As of July 2026, Power BI Pro costs £10.80 per user per month, whilst Power BI Premium Per User (PPU) is approximately £19 per month. Organisations with Microsoft 365 E5 subscriptions already have Power BI Pro included at no additional cost. This predictable per-user model allows businesses to migrate Excel to Power BI with a clear understanding of their monthly operational expenditure.